Implementing jointJS
[[TOC]]
What is jointJS
JointJS is an open-source JavaScript library that provides a comprehensive set of powerful features for creating interactive diagrams, graphs, and other visualizations within a web browser. It comes with built-in support for various diagram types, including flowcharts, mind maps, and UML diagrams. JointJS is highly customizable, allowing developers to create their own shapes and interactions, making it a perfect choice for implementing custom diagramming applications. Learn more about jointJS
Why Implement jointJS
Currently, our application displays data in tables, which, although useful for presenting information in a structured and organized manner, may not convey relationships and connections between different data points effectively. To improve the user experience and provide a better understanding of how data is connected, we have decided to implement JointJS, a JavaScript library for creating interactive diagrams and visualizations.
Creating A Graph
To create a blank canvas we must first add the graph paper. The stylings and methods of how to implement this background are written below
Typescript
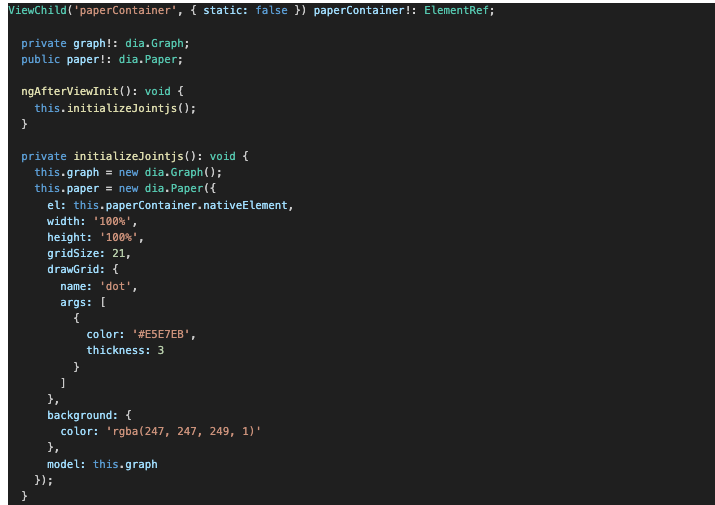
HTML

CSS
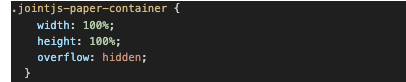
This creates a graph with the styling below

Standard jointJS Element
Created a custom element for an entity object element that looks like below
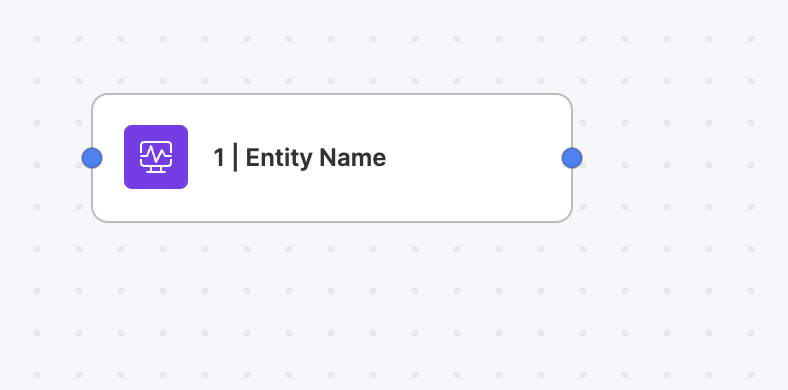
The custom element takes an entity object to display the name and id of the entity for the text of the custom element. The icon is provided through an svg in our assets folder
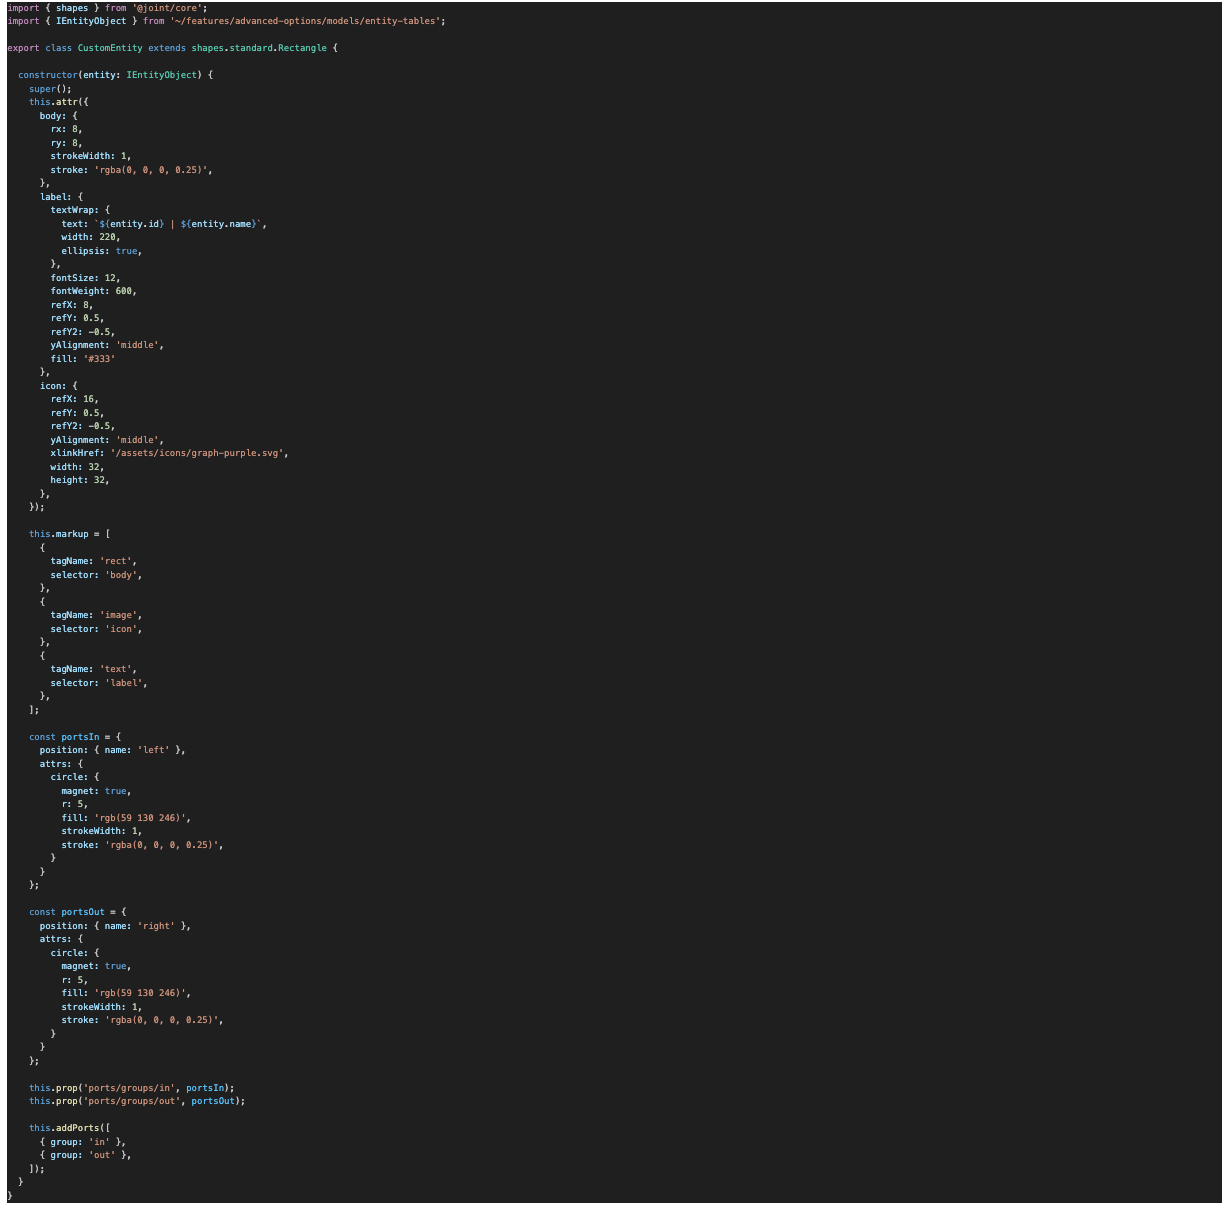
In order to use this custom entity element you can use the following function which feeds it the entity object and places and sizes it on the graph.

Currently the only parameter this takes is entity, but we can add to this or edit this if needed to feed it the icon, position and/or size pretty easily.